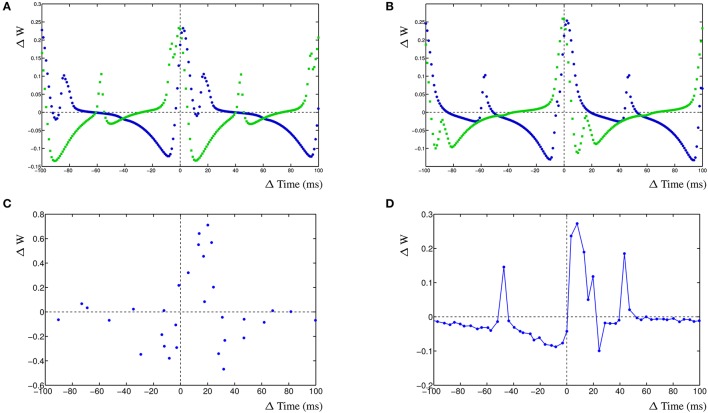
Figure 4.
Effect of postsynaptic action potential on synapses. (A) STDP curve with postsynaptic action potential with frequency ~10.1 Hz (99 ms) and two competing synapses, synapse 1 has an input frequency of 10 Hz (100 ms) and synapse 2 has an input frequency of ~9.9 Hz (101 ms). (B) STDP curve with postsynaptic action potential with frequency ~9.8 Hz (102 ms) and two competing synapses, synapse 1 has an input frequency of 10 Hz (100 ms) and synapse 2 has an input frequency of ~9.9 Hz (101 ms). (C) STDP plot, revisualized after Wittenberg and Wang (2006), showing a shifted LTP window and two LTD windows, stimulation frequency was 5 Hz. (D) Single compartment simulation of two synapses, one stimulated at 5Hz, one at 4.9 Hz and a BAP at 4.78 Hz. It results in a shifted LTP window and two LTD windows in the STDP curve. Also shown are two harmonic peaks at +43.35 and −47.3 ms that are not in the experimental data.

