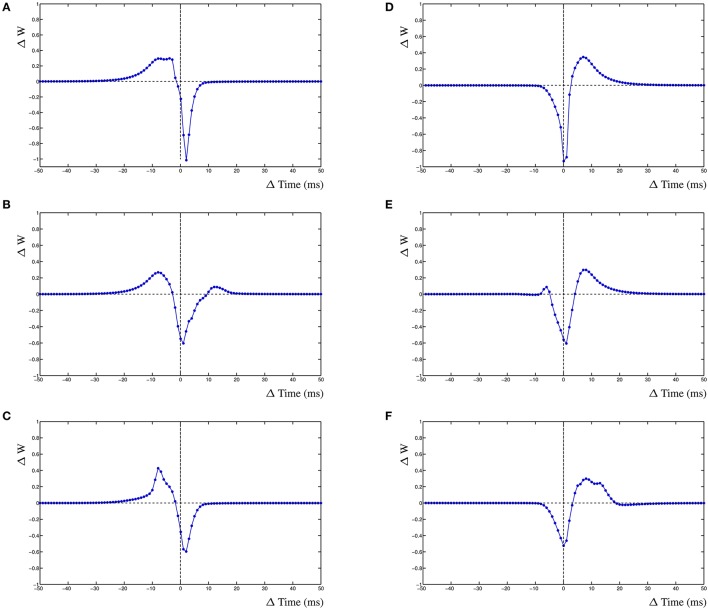
Figure 5.
Inhibition and the STDP curve. A single excitatory synapse and a single inhibitory synapse interact by modifying the postsynaptic activity. A postsynaptic action potential causes further adaptation. Shown is the STDP curve from the excitatory synapse. Left column (A–C) STDP curve of excitatory synapse driven by 5 Hz (200 ms) input with ~4.98 Hz (201 ms) inhibitory input. In (A,D) no further postsynaptic activity. In (B,E) an additional postsynaptic action potential at ~5.025 Hz (199 ms); in (C,F) the action potential has a frequency of ~4.95 Hz (202 ms).

