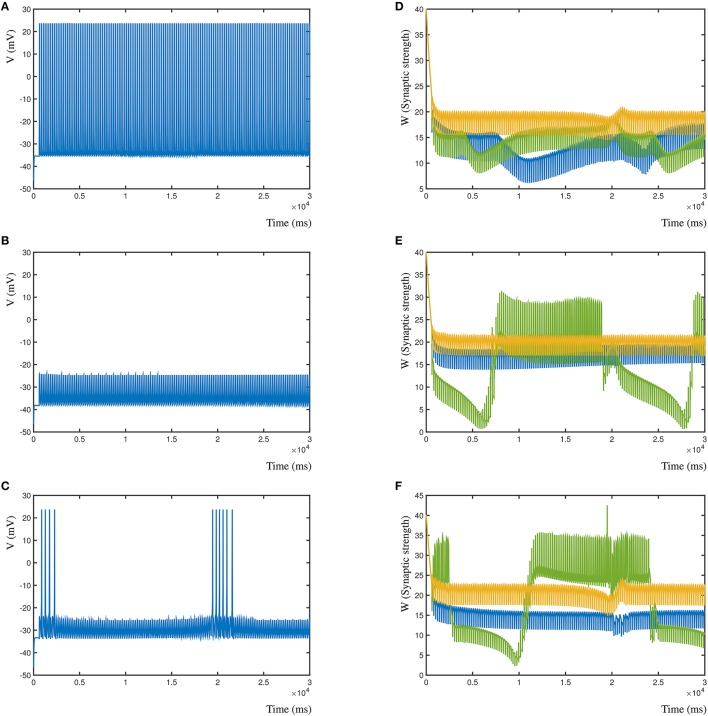
Figure 8.
Effect of different relative locations of the inhibitory synapse in relation to two excitatory synapses. (A) The post-synaptic voltage of the Morris-Lecar neuron when synapse A is inhibitory. (B) Post-synaptic voltage when synapse B is inhibitory. (C) Post-synaptic voltage when synapse C is inhibitory. (D) Synaptic strengths over time when synapse A is inhibitory. (E,F) Same for synapses B and C.

