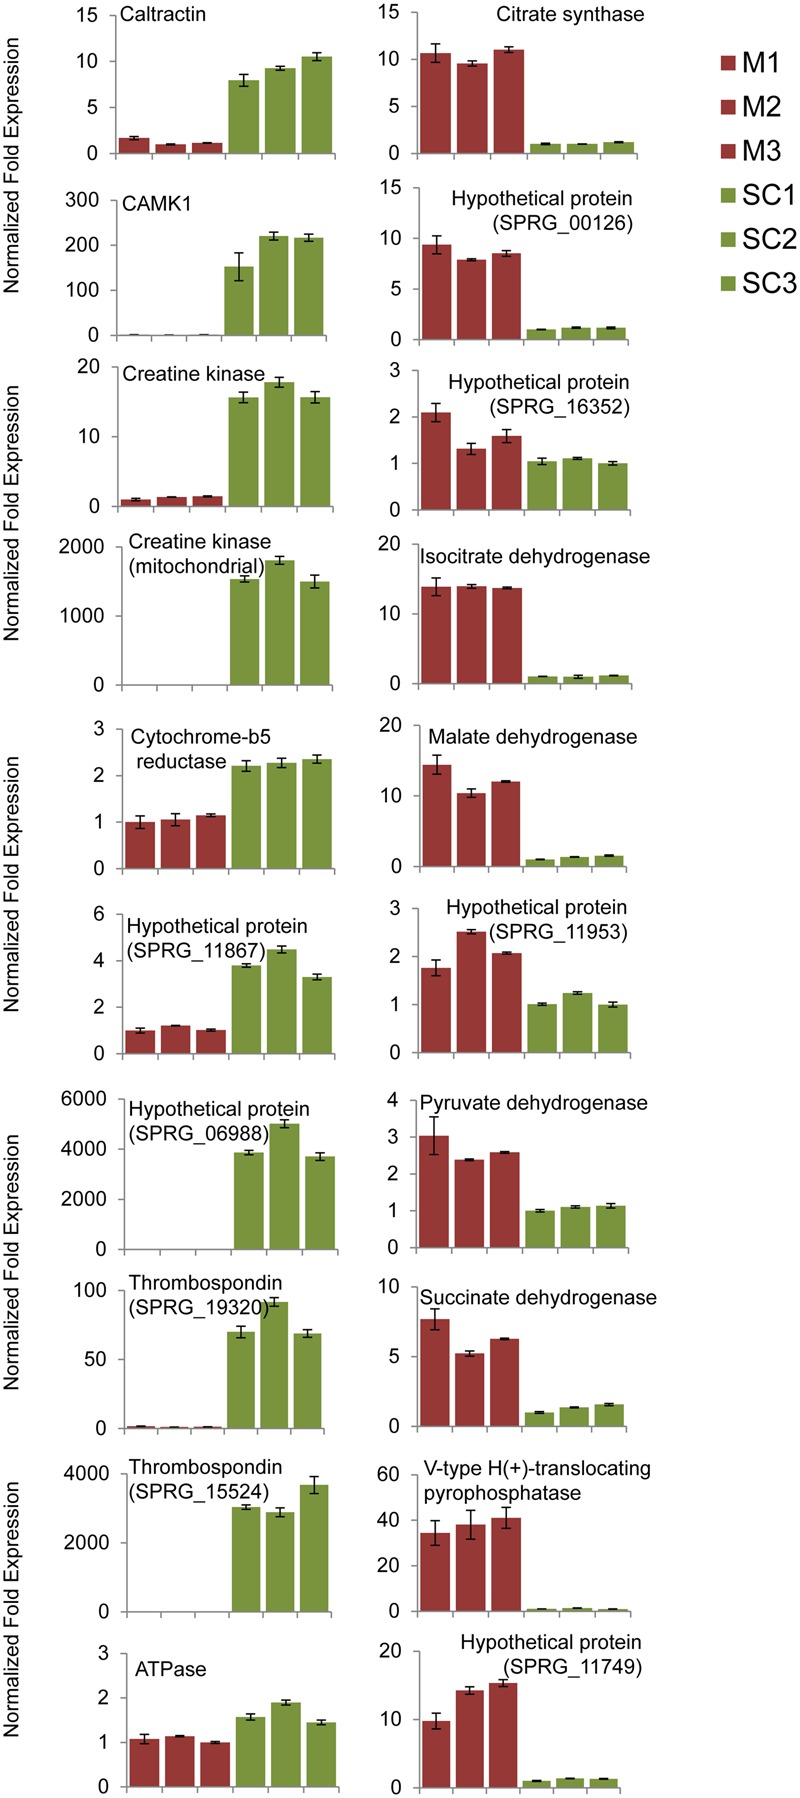
FIGURE 5.

Relative transcript abundance in the mycelium (M) and secondary cysts (SC) of S. parasitica. Gene expression was analyzed using quantitative RT-PCR. Relative expression levels were calculated by normalizing the data to the geometric mean of tubulin (SPRG_10729) and elongation factor (SPRG_10439). The vertical bars represent the standard errors of the mean normalized expression value for three separate biological replicates. Description and the corresponding accession number for each gene are shown in Supplementary Table S1.
