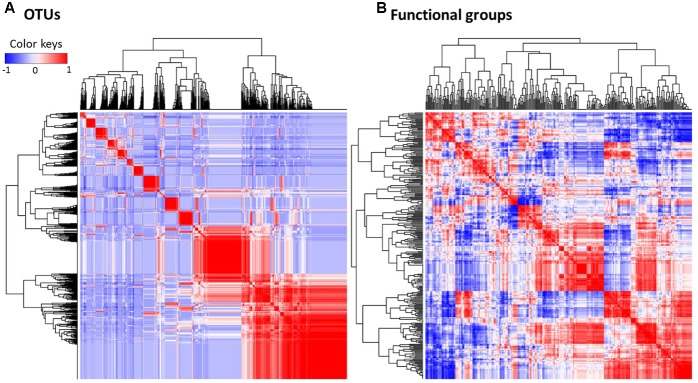
FIGURE 7.
Spearman’s correlation of the relative abundance profiles, which were calculated between (A) one OTU and all other OTUs, or between (B) one predicted functional groups and other groups of the gut bacteria. The tighter and more distinguishable clusters in bacterial OTUs (A) in contrast to the more dispersed and indistinguishable clusters of the functional groups (B) suggest more stable physiological functions compared to the composition of the gut microbial assemblage in changing environments. Red and blue colors indicate the positive and negative correlations, respectively. Color intensity represents the strength of correlation.

