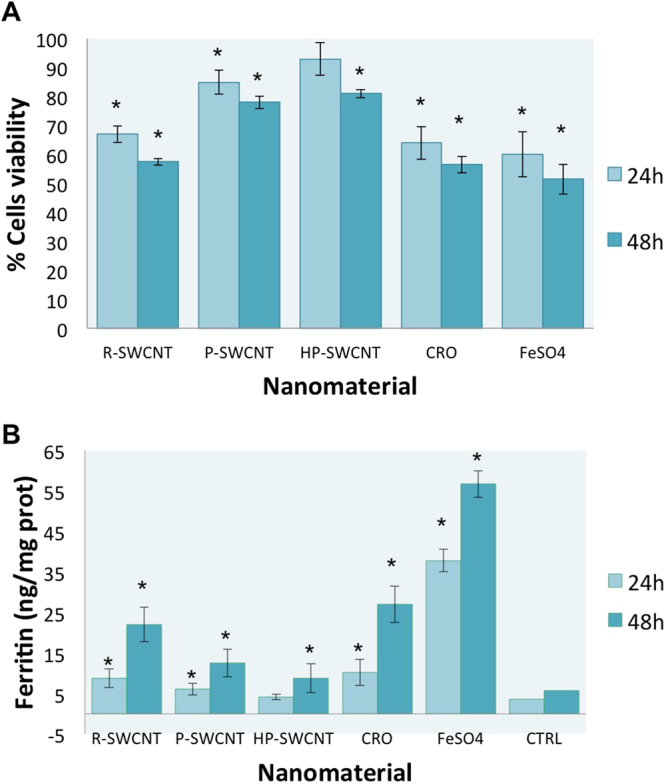
Figure 2.

Viability test of cells after treatments. Panel (A) shows the toxic effects of nanomaterials on vitality of MeT-5A cells. The cells are grown for 24 h and then treated with nanomaterials at 5 µg/ml for 24 h and 48 h. Relative cell viability was assessed by trypan blue dye exclusion method. Results are presented as percentage of living cells (*significantly reduced relative to control sample P < 0.05). Panel (B) shows the ferritin concentration of MeT-5A cells exposed to different nanomaterials (at the same conditions of viability test). Results are presented as nanogram of ferritin on milligram of total protein (*significantly increased relative to control sample P < 0.05).
