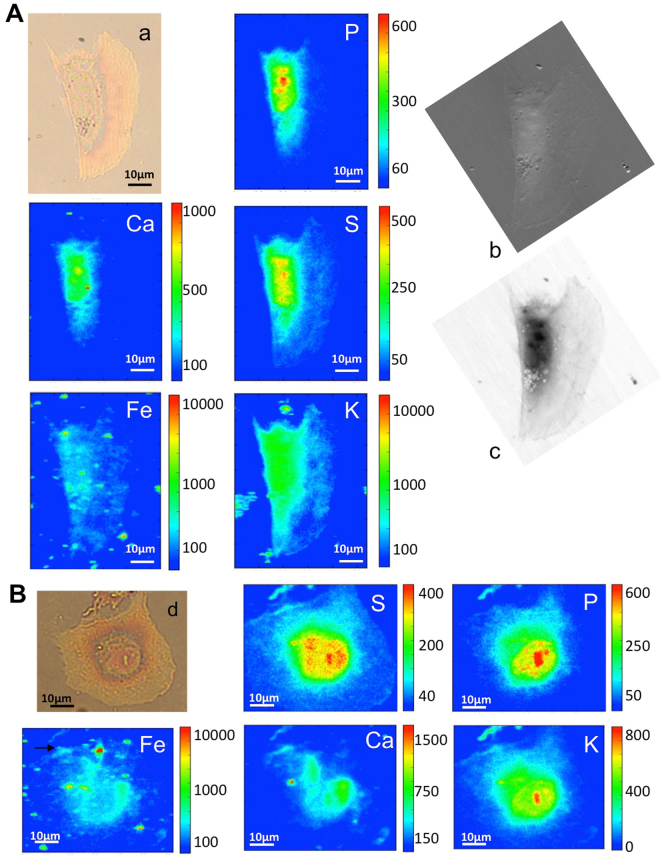
Figure 6.
µXRF and X-ray microscopy of treated cells. (A) Visible light image of cell exposed to raw carbon nanotubes (R-SWCNT) (a) and corresponding P, S, Ca, K, Fe XRF maps (54 µm × 70.5 µm). The X-ray microscopy absorption (c) and phase contrast (b) images of the corresponding cell are reported to the side. Panel (B) Shows the visible image of another treated cells (d) and the corresponding P, S, Ca, K, Fe XRF maps (62 µm × 50.5 µm). Fe map is displayed using a logarithmic scale. The absorption and phase contrast images were measured at the TwinMic beamline with photon energy 0.9 keV, whereas the XRF maps were acquired at ID21 beamline at 7.2 keV.

