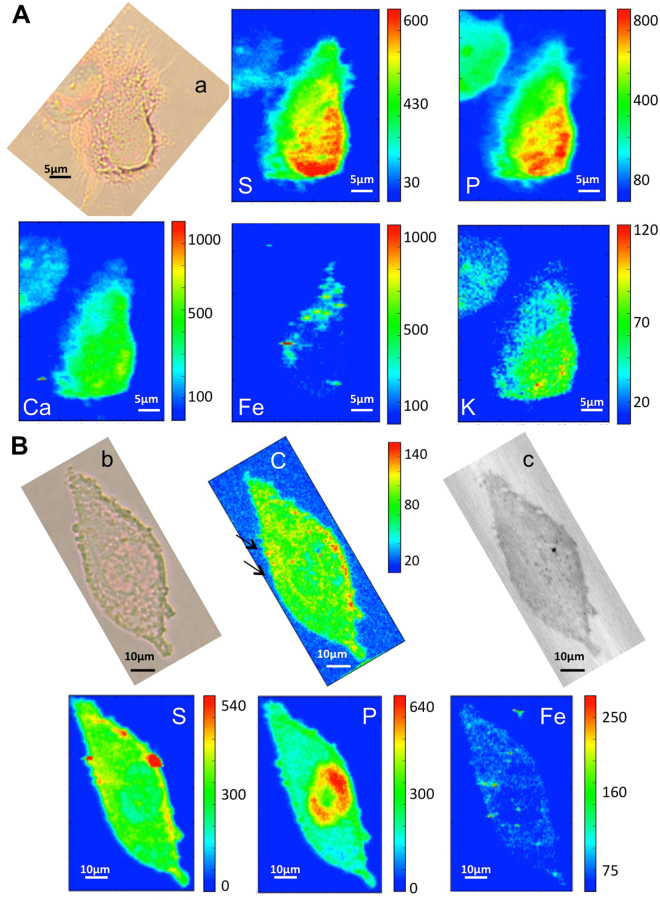
Figure 8.
µXRF and X-ray microscopy of treated cells. (A) Visible light image of cell exposed to highly purified carbon nanotubes (HP-SWCNT) (a) and corresponding P, S, Ca, K, Fe XRF maps (36 µm × 46,5 µm) collected at ID21 beamline. Panel (B) shows visible light and absorption (b,c) images of another treated cell. The C map obtained at TwinMic beamline (0.9 keV) and S, P and Fe maps collected at ID21 beamline (7.2 keV) are also reported in the panel. Fe map is displayed using a linear scale.

