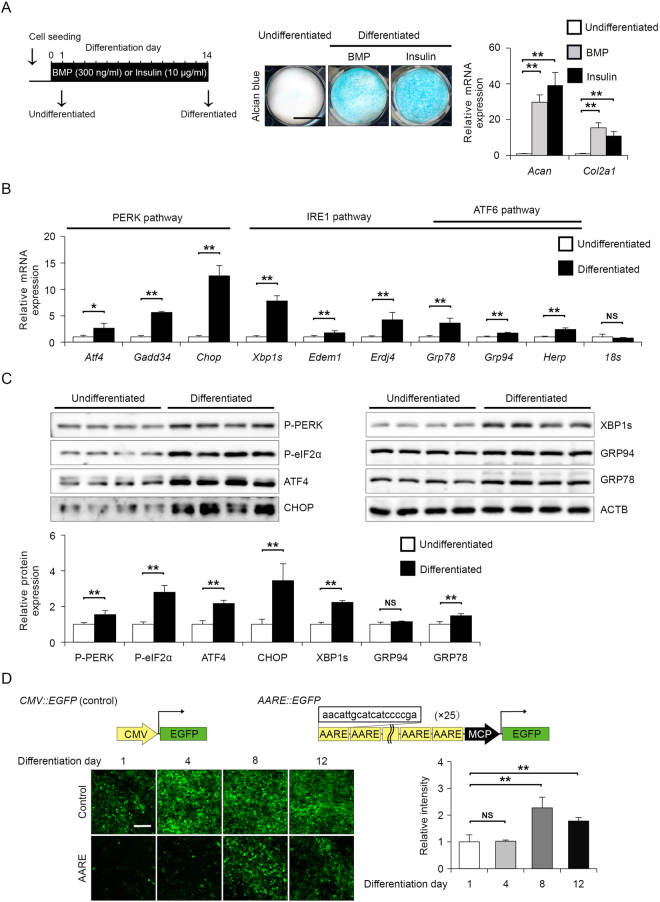
Figure 1.
Activation of the PERK pathway upon the chondrogenic differentiation of ATDC5 cells in response to insulin. (A) Representative alcian blue staining and RT-qPCR analysis of aggrecan (Acan), type 2A1 collagen (Col2a1) expression in ATDC5 cells at differentiation days 1 (undifferentiated) and 14 (differentiated). ATDC5 cells were induced to differentiate into chondrocytes with 10 μg/ml insulin or 300 ng/ml BMP. Data are presented as the mean fold change ± SD in differentiated cells versus that in undifferentiated cells (n = 4 technical replicates, **P < 0.01). Scale bar, 10 mm. (B) RT-qPCR analysis of Atf4, Gadd34, Chop, Xbp1s, Edem, Erdj4, Grp78, Grp94, Herp and 18 s expression in undifferentiated or differentiated ATDC5 cells. The mRNA levels were normalised to those of β-actin. Data are presented as the mean fold change ± SD in differentiated cells versus that in undifferentiated cells (n = 4 technical replicates, *P < 0.05, **P < 0.01). (C) Representative immunoblots and quantification of phosphorylated PERK, phosphorylated eIF2α, ATF4, CHOP, XBP1s, GRP94, GRP78 and ACTB in undifferentiated or differentiated ATDC5 cells. The protein levels were normalised to those of ACTB. Data are presented as the mean fold change ± SD in differentiated cells versus that in undifferentiated cells (n = 4 technical replicates, **P < 0.01). (D) Representative fluorescence micrographs of CMV::EGFP and AARE::EGFP ATF4 reporter ATDC5 cells on the indicated day after insulin stimulation. The fluorescence intensity ratio of target (AARE::EGFP) to control (CMV::EGFP) was determined and normalized to undifferentiated cells. The schema represents control and ATF4 activity GFP reporter constructs containing 25 tandem amino acid response elements (AAREs) (n = 4 technical replicates, **P < 0.01, NS = not significant). Scale bar, 200 μm.

