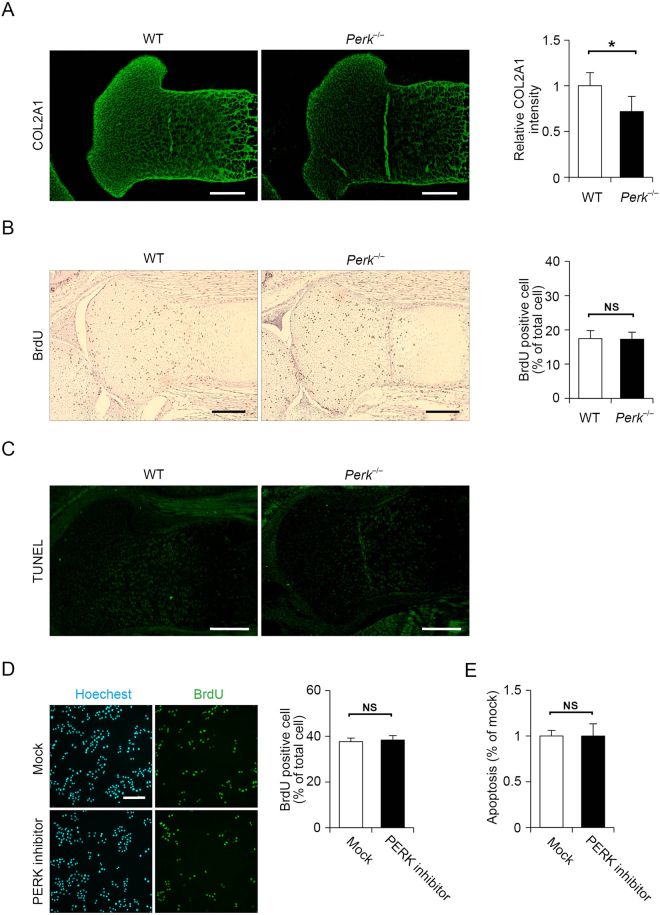
Figure 3.
Type 2A collagen (COL2A1) expression was decreased in Perk−/− mice without a reduction of proliferation or increase in apoptosis in chondrocytes. (A) Representative fluorescence micrographs of immunohistochemistry for COL2A1 of tibial sections from wild-type or Perk−/− mice at 18.5 dpc. Scale bar, 200 μm. Relative fluorescence intensity was presented as the mean fold change ± SD versus that of wild-type mice (n = 6 technical replicates, *P < 0.05). (B) Representative micrographs of immunohistochemistry for bromodeoxyuridine (BrdU) in tibial sections from wild-type or Perk−/− mice at 18.5 dpc. The sections were counterstained using hematoxylin. Scale bar, 200 μm. Ratio of BrdU-positive cells divided by the total number of cells was expressed as the mean ± SD (n = 5 technical replicates, NS = not significant). (C) Representative micrographs of TUNEL staining of tibial sections from wild-type or Perk−/− mice at 18.5 dpc. Scale bar, 200 μm. (D) Representative micrographs of immunohistochemistry for BrdU of rat chondrosarcoma cells treated with mock inhibitor or 2 μM PERK inhibitor for 12 h. The cells were counterstained using Hoechest 33258. Ratio of BrdU-positive cells divided by the total number of cells was expressed as the mean ± SD (n = 4 technical replicates, NS = not significant). Scale bar, 200 μm. (E) Quantitative assessment of apoptotic DNA fragmentation via nucleosomal DNA ELISA measuring the relative increase in primary chondrocytes treated with mock inhibitor or 2 μM PERK inhibitor for 24 h (n = 4 technical replicates, NS = not significant). Values were normalised by the total protein amount of the cells and shown as the mean ± SD.

