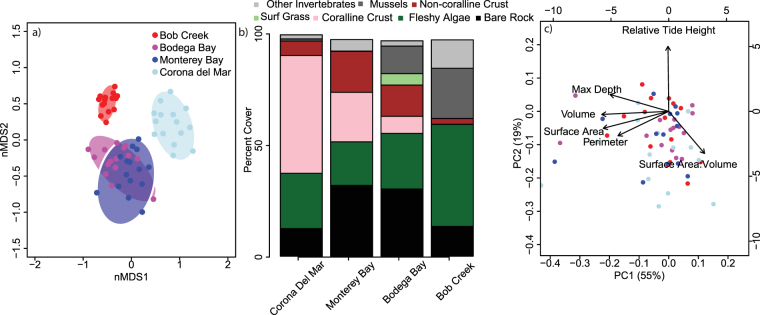
Figure 2.
Community composition and physical attributes of tide pool systems. (a) NMDS plot of community composition across tide pools grouped by site (2D stress = 0.19). (b) Average relative abundance (percent cover) of functional group across n = 13–15 tide pools per site. Colors represent functional groups with invertebrates in grey (dark grey is the percent of invertebrates that are mussels), non-coralline crust in red, surf grass in light green, coralline algae in pink, fleshy algae in dark green, and bare rock in black. (c) PCA of tide pool physical attributes. Values are PC scores for individual tide pools colored by site, and arrows indicate loadings of each variable. PC axes 1 and 2 explain 55% and 19% of the variance.

