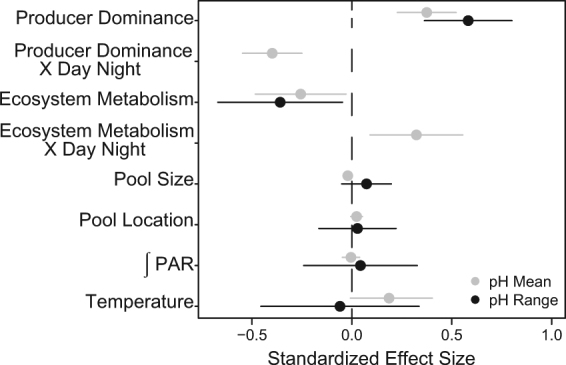
Figure 3.

Relative effect of biological and physical parameters on mean and range in tide pool pH. Standardized effect sizes for the pH mean (Table S4; grey) and the pH range (Table S3; black) models. Predictor variables are producer dominance (% cover of non-encrusting producers – % cover of consumers), ecosystem metabolism (TA/DIC slopes), pool size (PC1; Fig. 3), pool location (PC2; Fig. 3), log-transformed integrated PAR, and temperature (mean and range for the mean and range pH models, respectively). The pH mean model also included an interaction term for time of day (day or night) with producer dominance and ecosystem metabolism. Values are effect sizes ± 95% CI. All predictors and response variables were standardized, and values with 95% CIs that do not cross zero are considered statistically significant.
