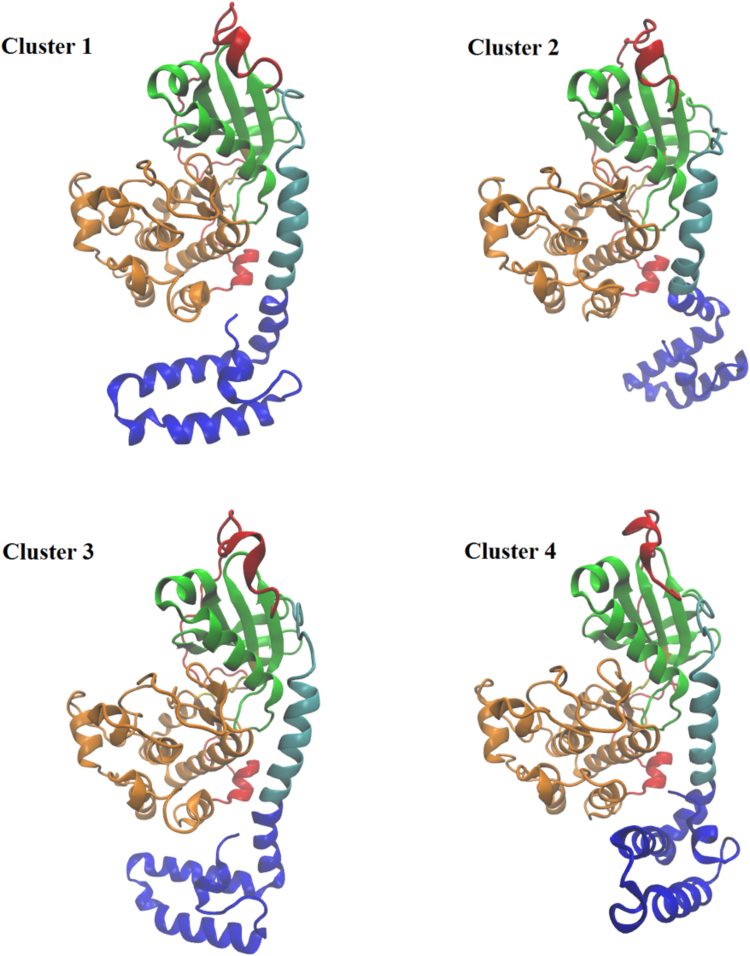
Figure 4.
Top four clusters by population from cluster analysis. The coloring scheme is the same as in Fig. 1. Representative structures are the structure with the smallest average RMSD distance to every other member of the cluster. Cluster 1 comprises 62% of all conformations, Cluster 2 comprises 13% of conformations, Cluster 3 comprises 9% of conformations, and Cluster 4 comprises 7% of conformations. The cluster analysis found a total of 21 clusters.

