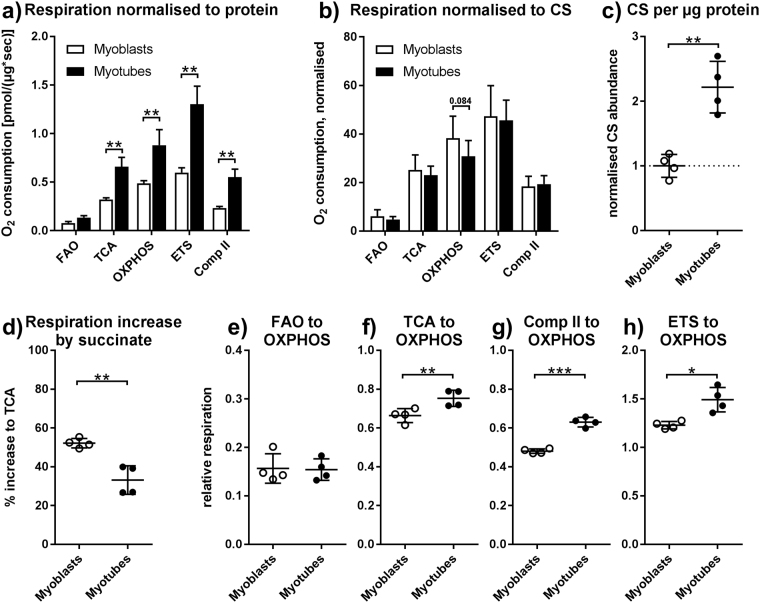
Figure 3.
Mitochondria in myotubes are more abundant and qualitatively different from mitochondria in myoblasts. Oxygen consumption of myoblasts and myotubes was measured according to the scheme in Fig. 2. Shown are only cells without TGFβ1 treatment. (a) Respiration normalised to total protein content post measurement. (b) Respiration normalised to total CS content post measurement. (c) CS content normalised to total protein content, both after measurement, and standardised to myoblasts. (d) Relative increase in respiration by succinate addition (e) β-oxidation respiration relative to OXPHOS capacity. (f) Respiration after addition of pyruvate relative to OXPHOS capacity. (g) Respiration after addition of rotenone relative to OXPHOS capacity. (h) Maximal FCCP respiration relative to OXPHOS capacity. (a,b) Repeated measures two-way ANOVA. (c to h) Paired, two-sided t-tests. *p < 0.05, **p < 0.01, ***p < 0.01. n = 4, mean ± SD.

