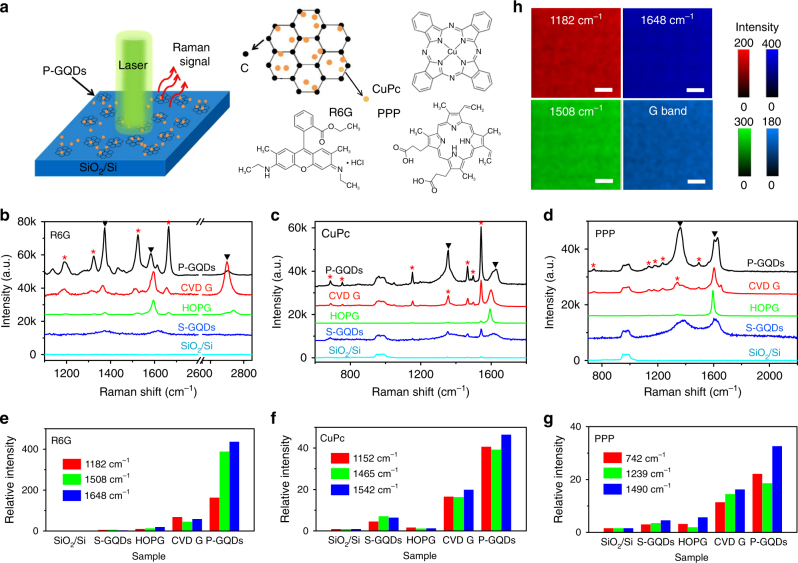
Fig. 3.
Raman enhancement of thermally evaporated R6G, CuPc, PPP on P-GQDs. a Schematic of a P-GQD substrate for Raman measurement. b–d Raman spectra of thermally evaporated rhodamine 6G (R6G), copper phthalocyanine (CuPc) and Protopphyrin IX (PPP) on SiO2/Si, graphene quantum dots produced by solution processes (S-GQDs), HOPG, transferred chemical vapor depostion (CVD) graphene and P-GQDs, respectively. Black arrows indicate the peaks from graphene, and red stars indicate the peaks from the target molecule. e–g Relative intensity of the Raman signals of R6G, CuPc and PPP on different substrates, normalized to the signals on SiO2/Si. h Raman mapping of the intensity of the G band and the characteristic peaks of R6G on P-GQDs. The scale bars are 10 μm in h. The unit of the colour bars are a.u. in h

