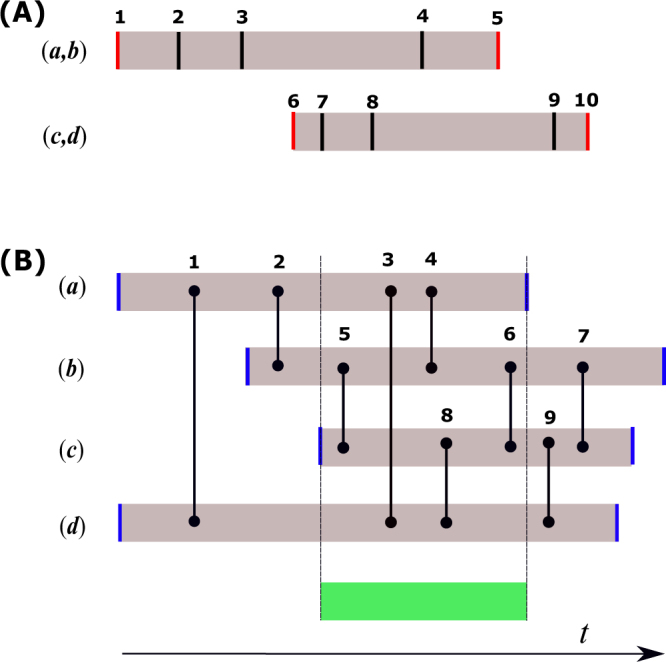
Figure 3.

Construction of the PTE and PTN reference models. In (A), we illustrate PTE by considering two edges (a, b) and (c, d) with 5 contacts each, labelled 1–5 and 6–10 respectively. Vertical lines represent the time when a contact is initiated. Red lines are contact initiation times that “activate” or “deactivate” an edge. We only permute times that do not activate or deactivate an edge. In this example, eligible permutations are (4, 7) and (4, 8). By contrast, (2, 7) is ineligible because the lifespan of (c, d) would be extended. In (B), we illustrate PTN. Vertical lines represent contact initiation times between nodes (a, b, c, d). Blue lines are node activation and deactivation times. Shaded areas depict the lifespans of nodes. To permute contact pairs from edges (a, b) and (c, d), we first obtain the intersection of the lifespans of nodes a, b, c and d, which is highlighted in green. The permutation of contact times is allowed only if the two contacts to be permuted are both located within the green interval. For instance, (4, 8) is an eligible permutation while (2, 9) is rejected because it would extend the lifespans of nodes a and c.
