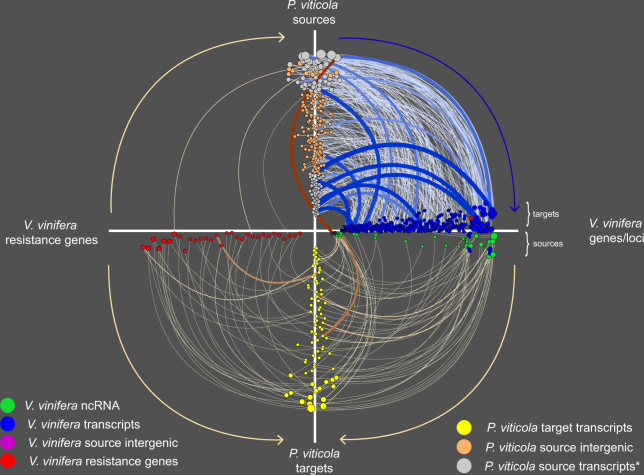
Figure 5.
Bidirectional cross-species sRNA-mediated gene regulation during the compatible interaction. The hive plot indicates the interactions between P. viticola sRNAs originating from either intergenic (yellow dots) or protein coding genes (gray dots) and V. vinifera genes (blue dots). Reciprocally, V. vinifera sRNAs processed from either noncoding RNA (green dots), intergenic regions (purple dots) or resistance genes (red dots) target P. viticola transcripts (yellow dots). The thickness and color intensity of the yellow and blue lines representing the sRNA-target interactions are proportional to the log transformed p-value calculated for the number of reads from the degradome whose 5′ end corresponds (±1) to the expected sRNA-mediated cleavage site: the larger the edge, the more significant the interaction. The color code is different for regulation starting (from light to dark blue) or arriving at P. viticola (from yellow to red). The size of the dots corresponds to the number of regulations identified for a certain sRNA.

