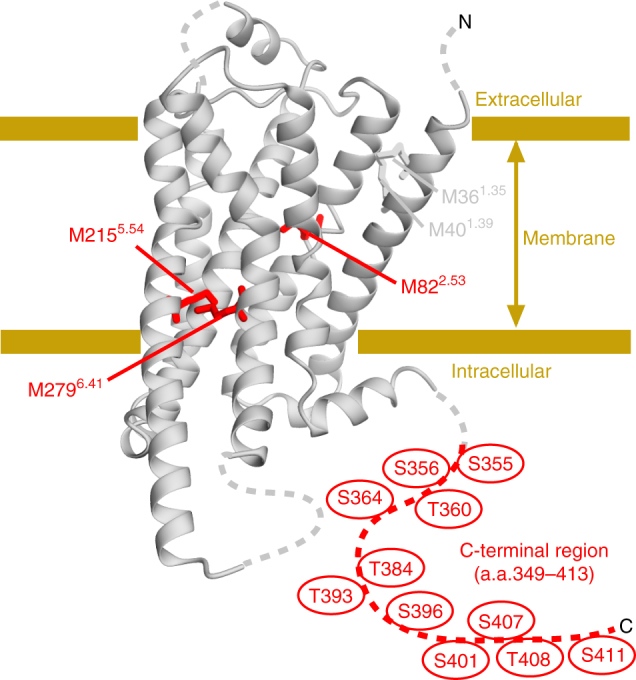
Fig. 1.

Distribution of the NMR probes on the structure of β2AR. The crystal structure of β2AR (PDB ID: 3SN6) is shown as a ribbon model. The N-terminal region, intracellular loop 3, and the C-terminal region, which are either substituted with T4 lysozyme, not observed, or truncated, are shown with dotted lines. The methionine residues observed for the analysis of the conformation of the TM region are shown as sticks. M822.53, M2155.54, and M2796.41, with resonances that reportedly exhibit remarkable chemical shift change upon activation, are shown as red sticks. The C-terminal region, which was segmentally labeled for the NMR observation, is shown by a red dotted line. The putative phosphorylated residues in the C-terminal region are shown. The structural model was prepared with Cuemol (http://www.cuemol.org/)
