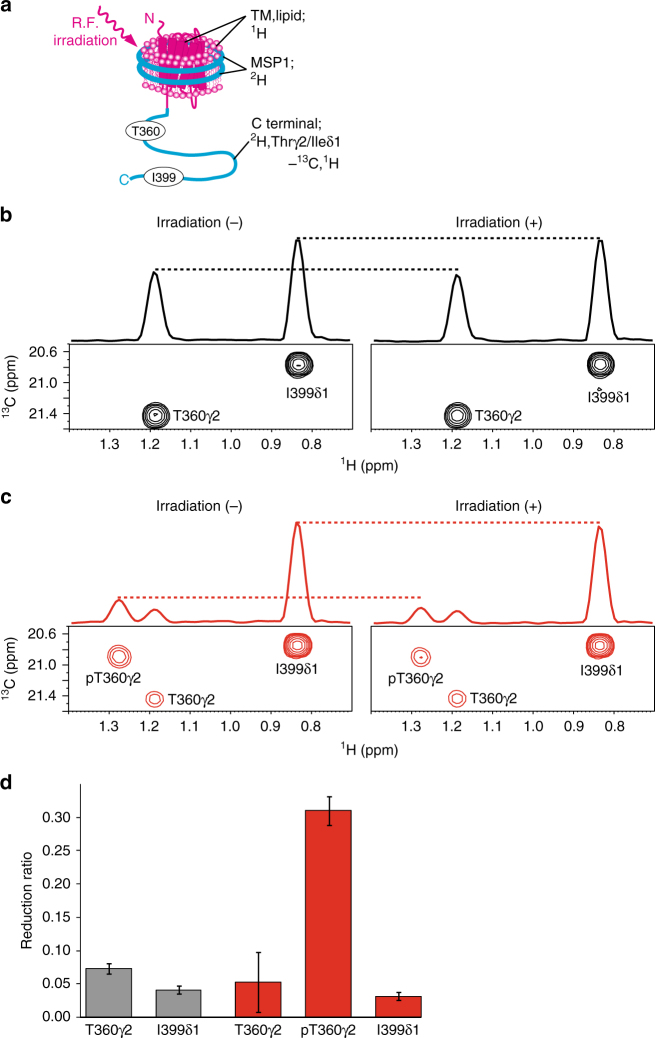
Fig. 4.
Interaction between the C-terminal region of β2AR and the membrane surface examined by the methyl-directed cross-saturation experiments. a Schematic diagram of the methyl-directed cross-saturation experiment, using segmentally-labeled β2AR. b, c Methyl-directed cross-saturation spectra of the C-terminal region of unphosphorylated β2AR (b) and phosphorylated β2AR (c). Spectra with and without irradiation are shown in the right and left panels, respectively. d Intensity reduction ratio of each resonance. Gray and red bars indicate the results in the unphosphorylated state and the phosphorylated state, respectively. The error bars represent the experimental errors, calculated from the root sum square of (noise level/signal intensity) in the two spectra, with and without irradiation

