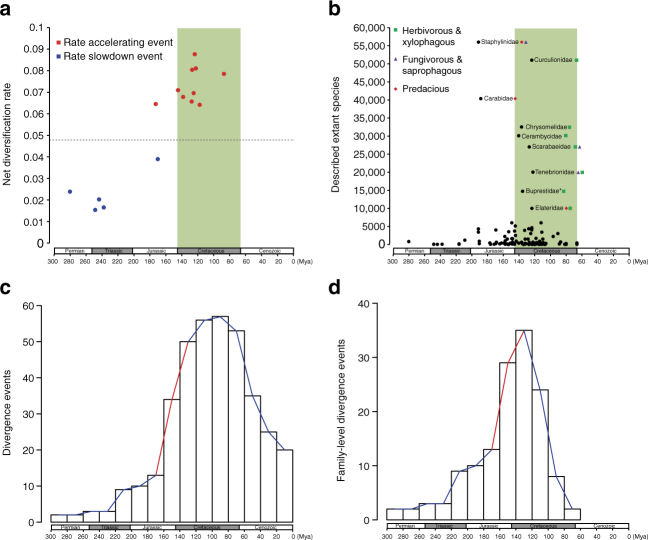
Fig. 5.
Diversification of beetles across the geological timescale. a Timing of the 15 significant changes in net diversification rate identified by MEDUSA. The dashed line denotes the background net diversification rate of Coleoptera. b Origin times and the species richness of beetle families. We used stem age as the origin time for a family when only one species is sampled for the family or when the taxon sampling did not cover the crown of the family. For non-monophyletic families, the stem age of the oldest lineage of the family was used. The nine largest families with species numbers >10,000 are highlighted with family names and feeding habits. For the Buprestidae (marked with an asterisk), we performed an additional time estimation, adding the Schizopodidae sequences from McKenna et al.16 to calculate the stem age of this family. c Number of divergence events within every 20 million year interval calculated from the 383-taxon time tree. Note that the diversification rate of beetles experienced an upsurge beginning from the late Jurassic (marked with a red line). d Number of divergence events within every 20 million year interval calculated from the family-level time tree. A similar diversification upsurge pattern was also detected in the late Jurassic

