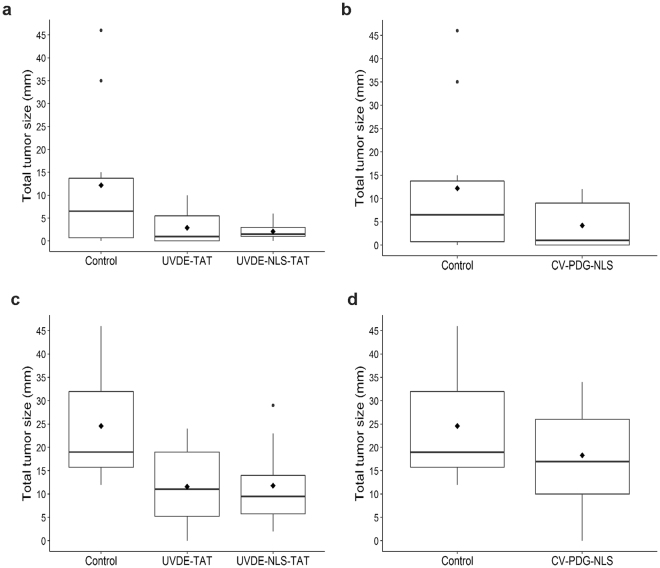
Figure 4.
Analyses of total tumor size at 23 and 33 weeks of UVB irradiation. To assess the extent of protection afforded by topical delivery of UVDE-TAT and UVDE-NLS-TAT Panels (a) and (c) and cv-pdg-NLS Panels (b) and (d), respectively, analyses of the aggregate size of UVB-induced tumors for each mouse are shown for data collected at 23 Panels (a) and (b) and 33 Panels (c) and (d) weeks of irradiation. All tumors were measured and the sum of all tumor diameters was calculated for each mouse to represent total tumor burden. Final measured (pre-death) tumor sizes were used for mice that required euthanasia prior to weeks 23 or 33. At each time point of interest, the sample distributions of total tumor size for each of the 4 groups of mice is displayed as a box plot with a horizontal line inside the box depicting the median, a diamond symbol denoting the mean, and outliers represented as circles outside the box. Group comparisons of total tumor burden at each of the two time points were conducted using analysis of variance (ANOVA).

