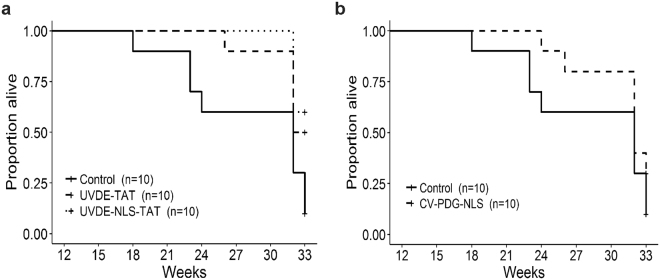
Figure 5.
Kaplan-Meier plot of survival. Throughout the course of UVB irradiation, mice were routinely monitored for tumors that became ulcerated or were >8 mm in diameter. Mice that met either of these criteria were euthanized, which served as the death endpoint for survival analysis. The proportion of mice not developing a tumor that met the above criteria is plotted across the study period. Panel (a) control empty liposome formulation (solid line), liposomes containing UVDE-TAT (dashed line), and liposomes containing UVDE-NLS-TAT (dotted line). Panel (b) control empty liposome formulation (solid line) and liposomes containing cv-pdg-NLS (dashed line). The plotted survival proportions were estimated using the Kaplan-Meier method and statistically compared with the log-rank test. Mice that did not meet the criteria for euthanasia by the end of the 33-week study period (i.e., censored observations) were represented with plus (+) signs. Since all mice were analyzed until either (i) euthanasia due to tumor criteria or (ii) the study ended, there was no censoring prior to the last observed time point at 33 weeks and Kaplan-Meier estimates were equal to the sample proportions of mice remaining alive at any given time.

