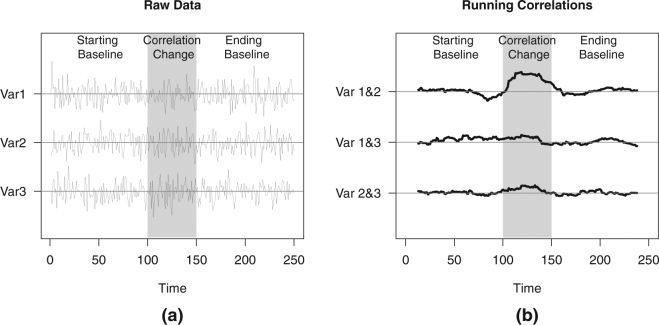
Figure 1.
Time series and running correlation plots for the toy example. In (a), a time series comprised of three variables drawn from a multivariate normal distribution with zero means is displayed. In the baseline phases (white background), variables are uncorrelated and have a unit variance such that the covariance matrix is equal to . In the middle phase (gray background), an event is introduced such that the correlation between the first two variables increase, giving a covariance matrix of . In (b), the running correlations obtained using a window size of 25 time points are exhibited.

