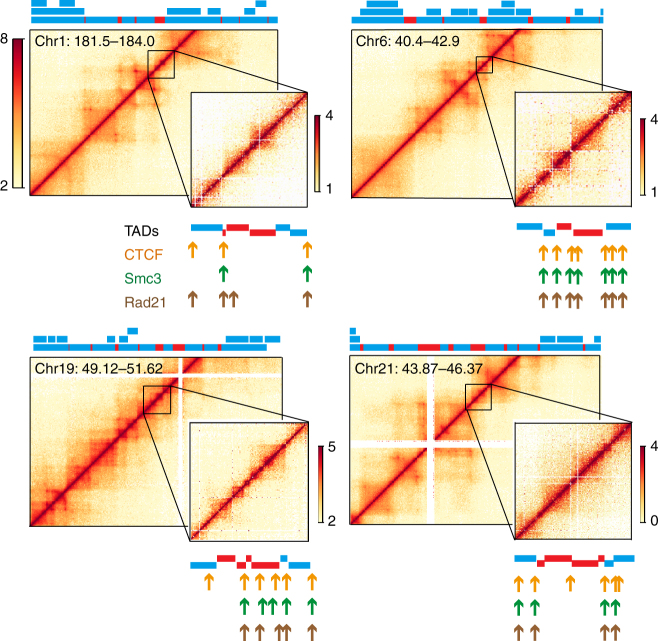
Fig. 4.
The human genome is also partitioned into contiguous small TADs within previously described “inter-TAD” regions at least in part. Shown are four examples of Hi-C data of GM12878 lymphoblastoid cells determined by Rao et al.24 In each panel, the main figure is the heatmap of the indicated chromosomal position at 5 kb resolution, with the domains annotated by these authors indicated by the color bars above each figure. Note that there were smaller TADs within larger TADs identified in this previous work, reflected in the three different levels in the annotated TADs. The bars colored red reflect the inter-TAD regions, while those colored blue are the TADs. The inset of each panel is an expanded region of an inter-TAD region. The TADs annotated using the Armatus software are shown below the heatmap. Also shown are the locations of CTCF (orange arrows) and cohesin components (Rad21 and Smc3, green and brown arrows. respectively), as determined previously24

