Figure 3.

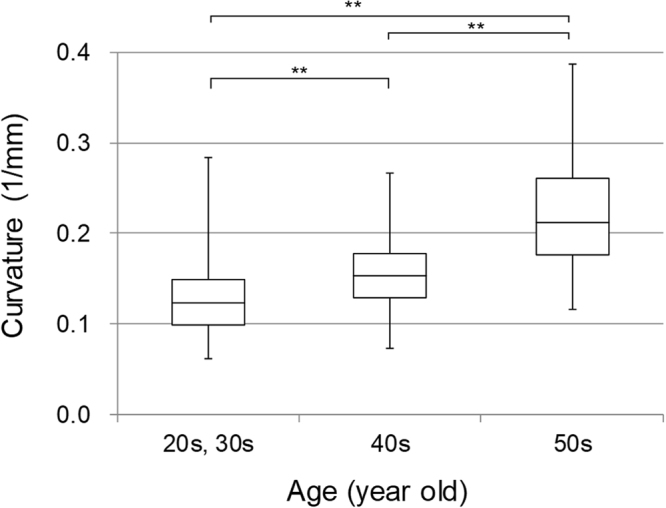
Results of statistical analysis of the curvature of the palmar arteries as a function of each age rage. Comparison was made in groups of individuals in their 30 s and under and those in their 40 s and 50 s. (**p < 0.01).

Results of statistical analysis of the curvature of the palmar arteries as a function of each age rage. Comparison was made in groups of individuals in their 30 s and under and those in their 40 s and 50 s. (**p < 0.01).