Figure 1.
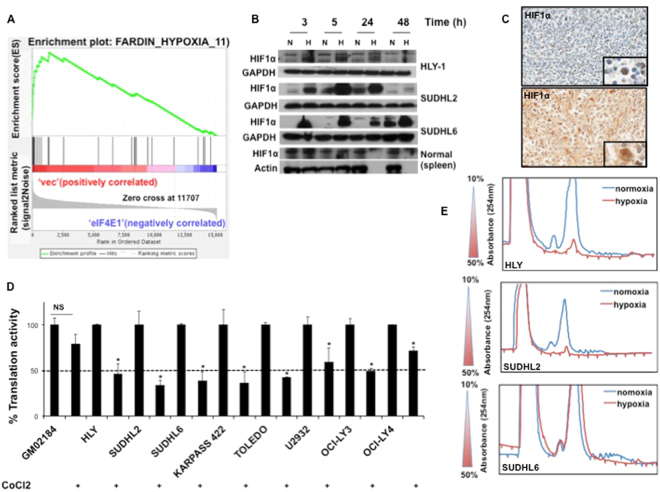
Hypoxia inhibits translation in DLBCL cells. (A) GSEA analysis of published eIF4E1 translatome to predict regulation of hypoxia targets in DLBCL (B). Activation of HIF1α in DLBCL cell lines. Western blot analysis to determine HIF1α expression in hypoxia following 3, 5, 24 or 48 h of hypoxia. (C) IHC of HIF1α in malignant DLBCL and normal lymphoid tissue (D) Global repression in translation under hypoxia Cells were treated with CoCl2 for 48 h. This was followed by labeling with (35S-methionine) for an hour. Translation activity was measured by calculating the amount of 35S-met incorporated into protein by using a scintillation counter. Translation efficiency was set to 100% for cells cultured under normoxia. Data is plotted as an average of n = 3 ± SE and was normalized to the cell number. (E) Polysomal profiling is depicted for DLBCL cells HLY, SUDHL2 and SUDHL6 cultured under normoxia or hypoxia for 48 h. Sucrose gradient ranging from 10 to 50% is displayed on the left. Examples of changes in polysomal profiles in different DLBCL cell lines cultured under normoxia and hypoxia are shown on the right. Blue line represents control and red represents reduced mRNA translation under hypoxia.

