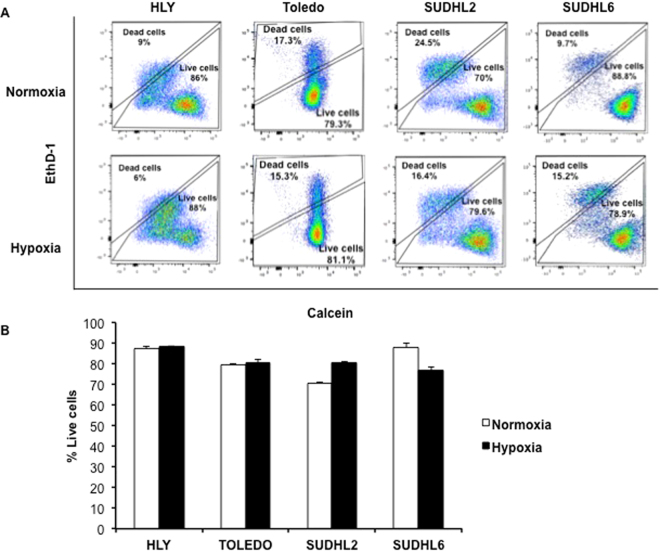
Figure 4.
Cell growth of lymphoma cell lines under hypoxia. (A) Quantitation of live and dead cells in lymphoma cells after incubation in 1% oxygen (hypoxia) for 24 hours using Calcein- AM (Calcein acetoxymethyl ester) and EthD-1 by flow cytometry (FACS CANTO II), n = 3 ± SD. Representative images of live and dead cells in DLBCL cell lines HLY, SUDHL2 and SUDHL6 as determined by flow cytometry are depicted. (B) Results are expressed as the percentage of live cells in DLBCL cell lines under normoxia and hypoxia, respectively.

