Figure 5.
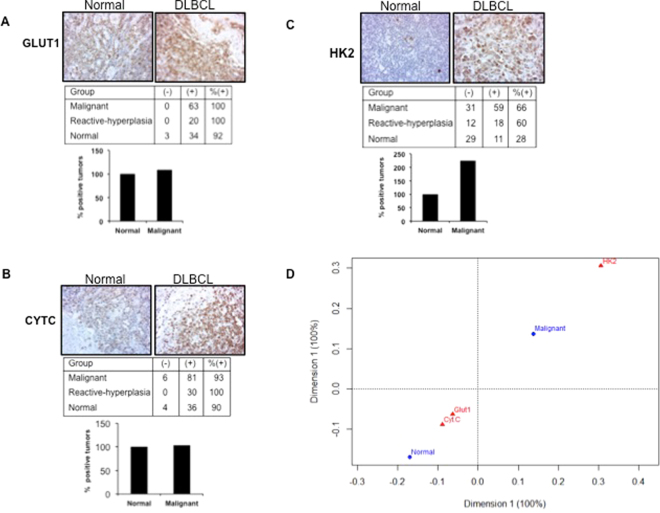
Tumor tissue microarray staining and analysis of DLBCL patient samples. Summary of lymphoma tissue microarray expression of GLUT1, Cyt-C and HK2 staining are depicted in respective tables (A), (B) and (C). Number of tumor cores negative for staining is shown in the column marked as (−) and tumor cores with positive staining are depicted in the column marked as (+). Positive percentage tumor for each staining is indicated. The percentage difference in the number of positive tumors in the normal and malignant group for expression of GLUT1, Cyt-C and HK2 in shown as a bar graph with scale set to 100% for the normal group in each case. (D) Correspondence analysis of array expression data to establish the relationship between marker and phenotype. HK2 was closely related to the malignant group compared to the other markers GLUT1 and Cyt-C, which were closer to the normal group. The position of a variable on the CA graph from the origin indicates the extent of similarity of its response profile compared to the average. The markers GLUT1 and Cyt-C are closer to the origin, which indicates that their contribution to the observed phenotype is small. The farther location of HK2 implies a larger deviation from the expected contribution and its importance to the observed phenotype.

