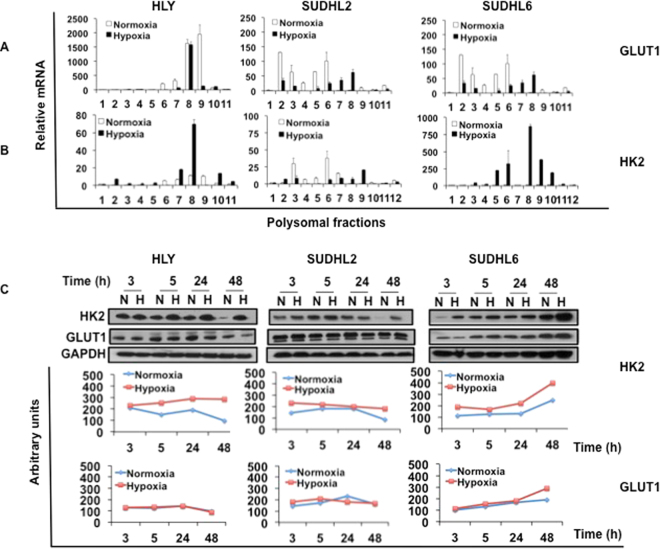
Figure 6.
Effect of hypoxia on translation of GLUT1 and HK2 in DLBCL cell lines. Polysomal analysis of GLUT1 and HK2 in HLY, SUDHL2 and SUDHL6 cells maintained under normoxia or hypoxia. RNA was isolated from each polysomal fraction using Trizol and was subjected to RT-PCR analysis. Distribution of (A) GLUT1 and (B) HK2 in different polysomal fractions. Increased GLUT1 and HK2 levels were associated with heavier polysomal fractions ranging from 7–12. (C) DLBCL cells were exposed to normoxia and hypoxia for the indicated time points. The amount of GLUT1 and HK2 protein was detected by immunoblot analysis. GAPDH was used as a loading control. Protein expression for 3, 5, 24 and 48 h was quantitated using Image J software and is depicted in panels below the respective protein blots.

