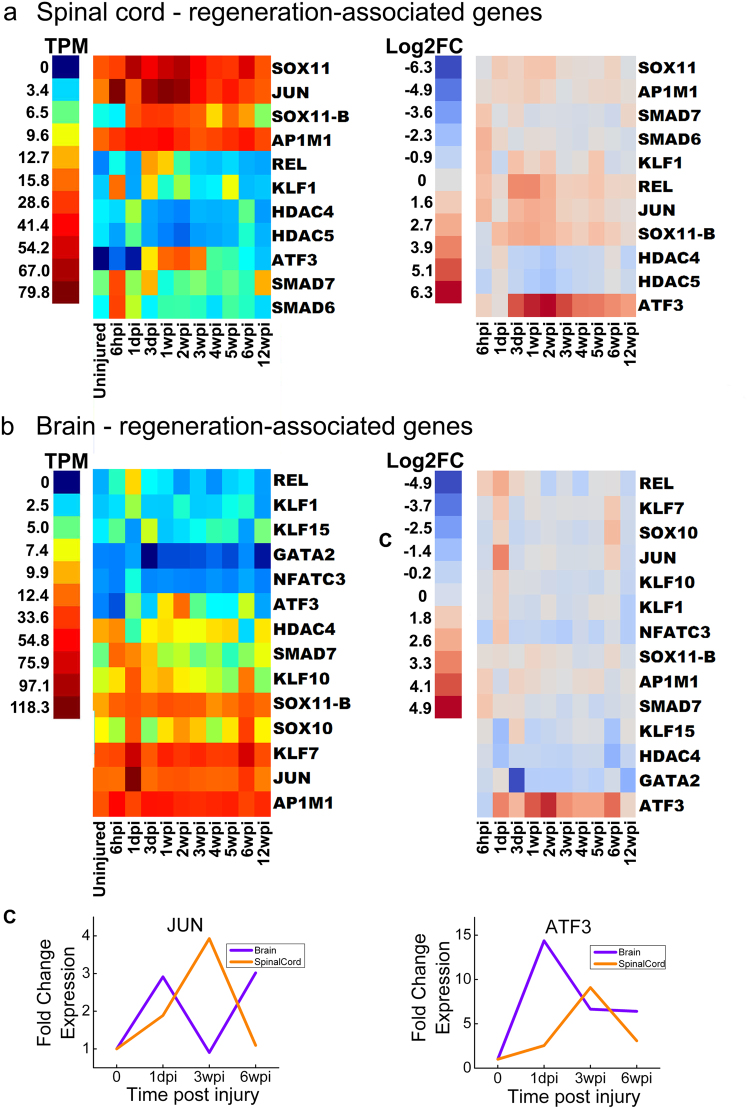
Figure 5.
Temporal expression patterns of regeneration associated genes (RAGs). Heat maps generated from RNA-Seq data showing expression of genes that were differentially expressed at least once during the experimental time course for spinal cord (a) and brain (b). Left panels show expression data and right panels show log2-fold changes (FC) relative to the uninjured state. TPM = transcripts per million reads. Lamprey gene IDs and corresponding gene symbols are found in Supplementary Table S2. (c) qPCR data showing expression changes for JUN and ATF at 1dpi, 3wpi, and 6wpi, compared to uninjured controls (time 0).

