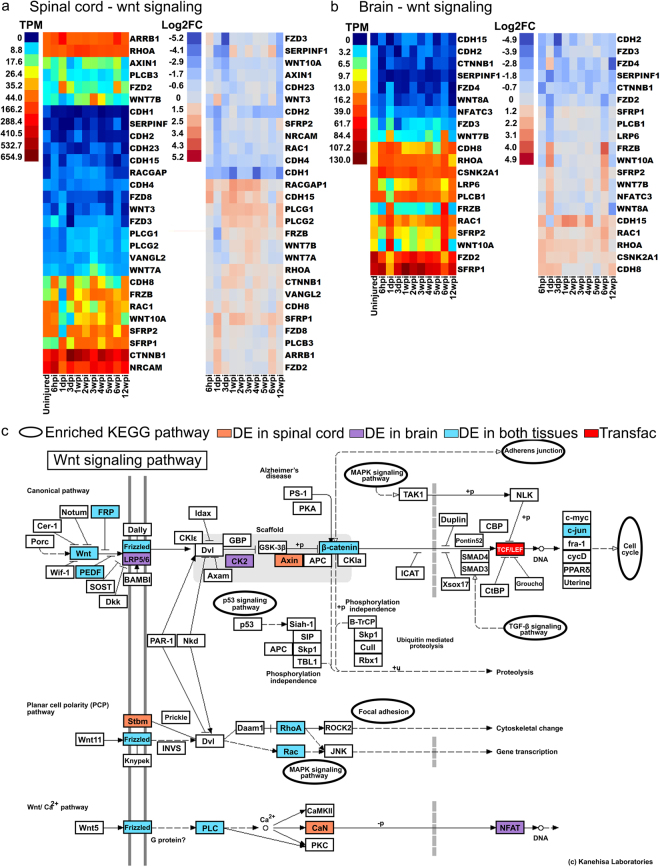
Figure 6.
Differential expression of Wnt signaling pathway genes after spinal cord injury. (a,b) Canonical and non-canonical Wnt signaling pathways are shown. Genes that were differentially expressed at least once during the experimental time course are indicated in red (up) or blue (down) regulated. Heat maps showing expression of genes that were differentially expressed at least once during the experimental time course for spinal cord and brain. Left panels show raw expression data and right panels show log2-fold changes (FC) relative to the uninjured state. TPM = transcripts per million reads. Lamprey gene IDs and corresponding gene symbols are found in Supplementary Table S2. (c) KEGG analysis of the Wnt signaling pathways showing transcripts identified as differentially expressed in spinal cord (orange), brain (purple) or both (blue). KEGG pathway map 04310 is adapted here from http://www.kegg.jp/kegg/kegg1.html. The KEGG database has been described previously93–95.

