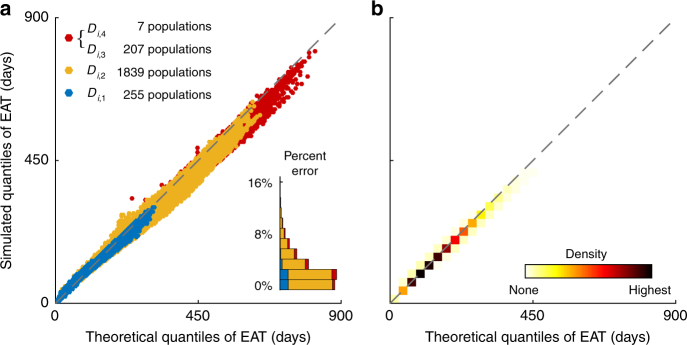
Fig. 3.
Validating the framework in the WAN. The epidemic origin is Hong Kong as in Fig. 2. a Analogous to Fig. 2d–f, with populations in Di,c (c = 1, 2, 3, 4) color-coded. Analytical EATs are computed using NPP superposition as described in the main text (see The WAN analysis in Methods for algorithmic details). b Density of the data points in a to show that nearly all the 230,800 Q—Q plots align with the diagonal, which indicates congruence between simulated and analytical EATs. Supplementary Figure 7 provides analogous results with other major hubs in the WAN as the epidemic origin

