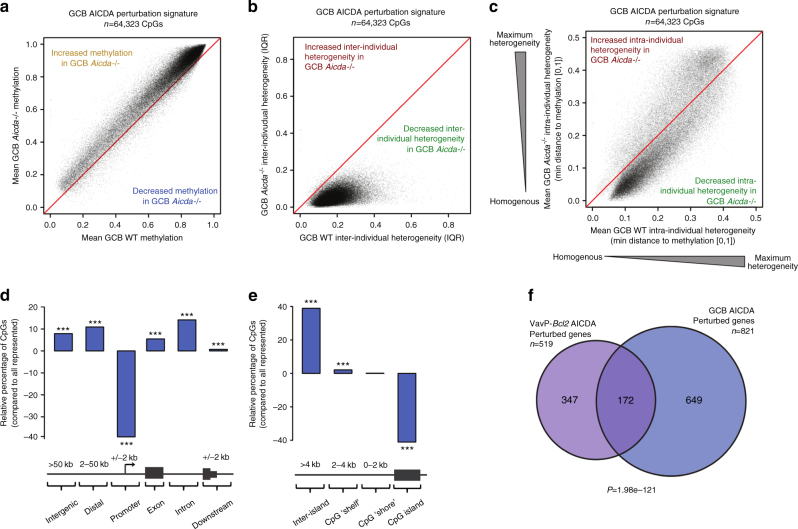
Fig. 3.
Loss of AICDA in GC B cells reduces DNA methylation heterogeneity and causes relative gain in methylation. a–c Scatterplots showing shift in mean methylation values (a), inter-individual methylation heterogeneity (b), and intra-individual methylation heterogeneity (c) of GC Aicda−/− perturbation signature between Aicda−/− and wild-type GC B cells. d Bar plot showing the distribution of GC Aicda−/− perturbed CpGs relative to the distribution of all represented CpGs; Fisher’s exact test. e Bar plot showing the relative distribution GC Aicda−/− perturbed CpGs within proximity to CpG islands; Fisher’s exact test. f Venn diagram showing the overlap between genes significantly over-representing GC Aicda−/− signature CpGs and genes over-representing VavP-Bcl2+Aicda signature CpGs; hypergeometric test. (*P < 0.05, **P < 0.01, ***P < 0.001)

