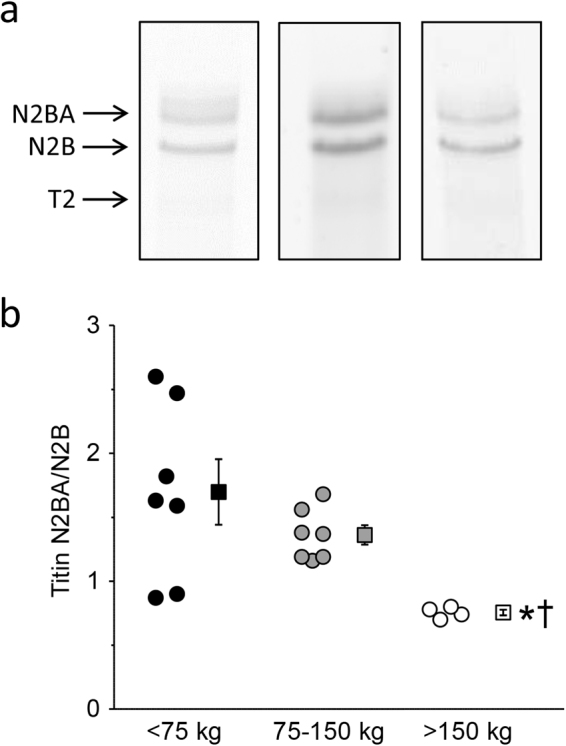
Figure 5.

Titin isoform content in an animal in each of the three weight categories. (a) Gels showing titin isoform staining using SYPRO Ruby protein staining. Each example is from a different gel and gels are cropped. (Full length gels are included in Supplementary Information S4). The grayscale of the 75–150 kg-group gel is adjusted to generate equal appearance of the three gels. (b) Bar graph showing titin ratio (N2BA/N2B isoform). Ratio is decreased in the highest weight category, indicating a shift from the compliant N2BA titin isoform towards the stiff N2B titin isoform. Measured in a subset within each group (n = 7, n = 7 and n = 4, respectively, for each group); Data are presented as individual animal data points and as mean ± s.e.m.; *P < 0.05 vs < 75 kg-group; †P < 0.05 vs 75–150 kg-group (by One-Way ANOVA followed by SNK post-hoc testing).
