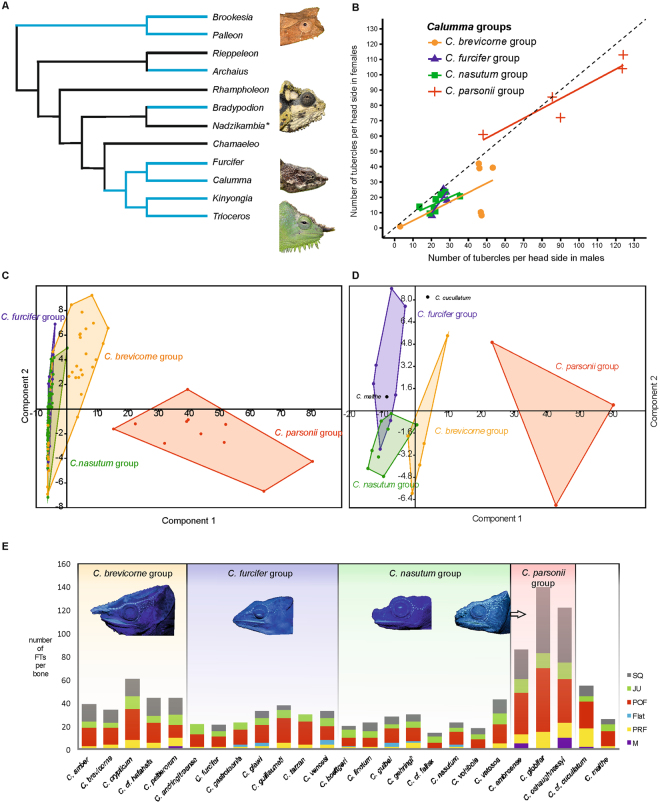
Figure 3.
Analysis of distribution of FTs on adult individuals of Calumma species groups. (A) Schematic chameleon phylogeny of Tolley et al.27 updated with genus Palleon, light blue lines indicate genera where fluorescence occurs (* indicates genus where no data was available). (B) Mean value of fluorescent tubercles (FTs) per head side and species, males plotted against females of 126 individuals/24 species assigned to four species groups; dashed diagonal line shows 1:1 ratio, samples below it show more tubercles in males than females. (C,D) PCA scatter plots assigned to four species groups, factor loadings are given in Supplementary Tables S2, 3; (C) Distribution of FTs per head side based on 12 characters (Supplementary Table S4) of 140 individuals/29 species. (D) Number of FTs per cranial bone from lateral view of 25 adult males of different Calumma species based on 6 characters (Supplementary Table S5). (E) Bar charts of number of FTs per cranial bone (M, maxilla; PRF, prefrontal; Flat, frontal seen laterally; POF, postorbitofrontal; JU, jugal; SQ, squamosal; see Fig. 1D) from lateral view of 25 adult males of different Calumma species.

