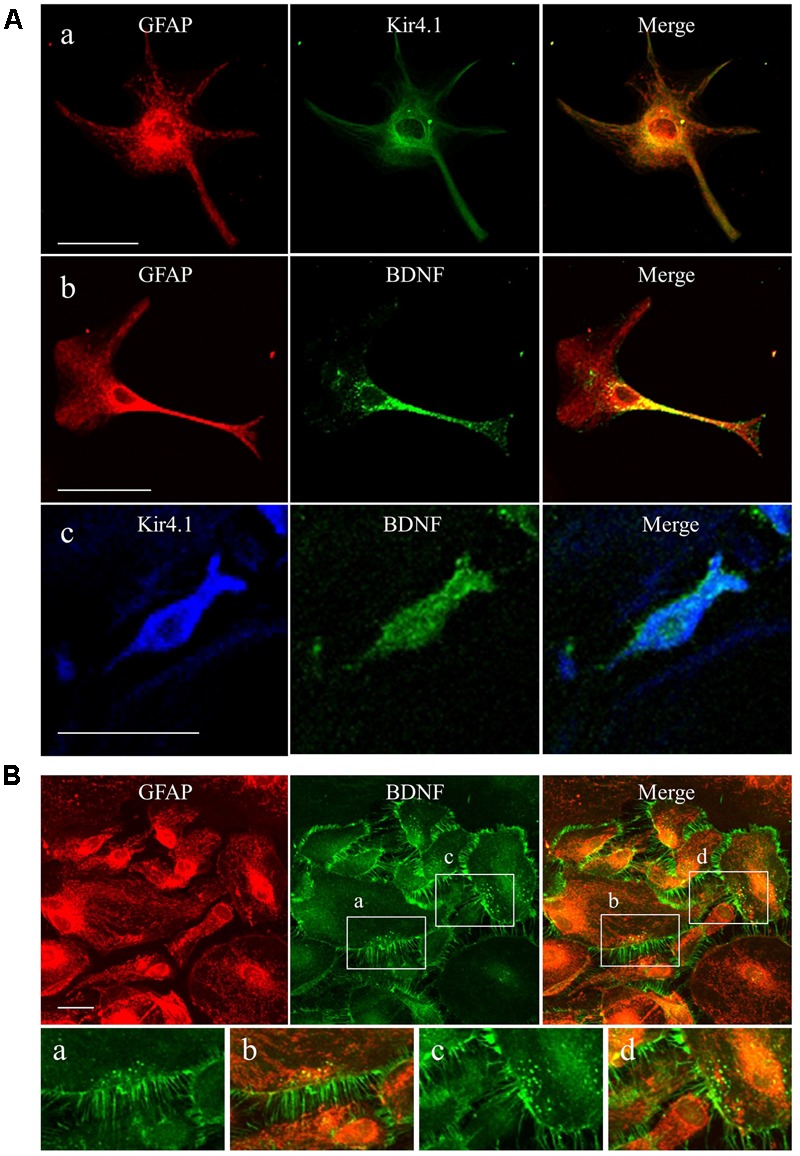
FIGURE 1.

Expression patterns of Kir4.1 channels and BDNF in cultured astrocytes. (A) Representative images of double-immunofluorescent staining for GFAP and Kir4.1 (a), GFAP and BDNF (b), or Kir4.1 and BDNF (c) in single astrocytes. (B) Clustered astrocytes stained for GFAP and BDNF in culture preparations. Lower panels showed magnified images of region indicated by squares (a–d). Scale bar: 50 μm (Aa, Ab, and B) or 25 μm (Ac).
