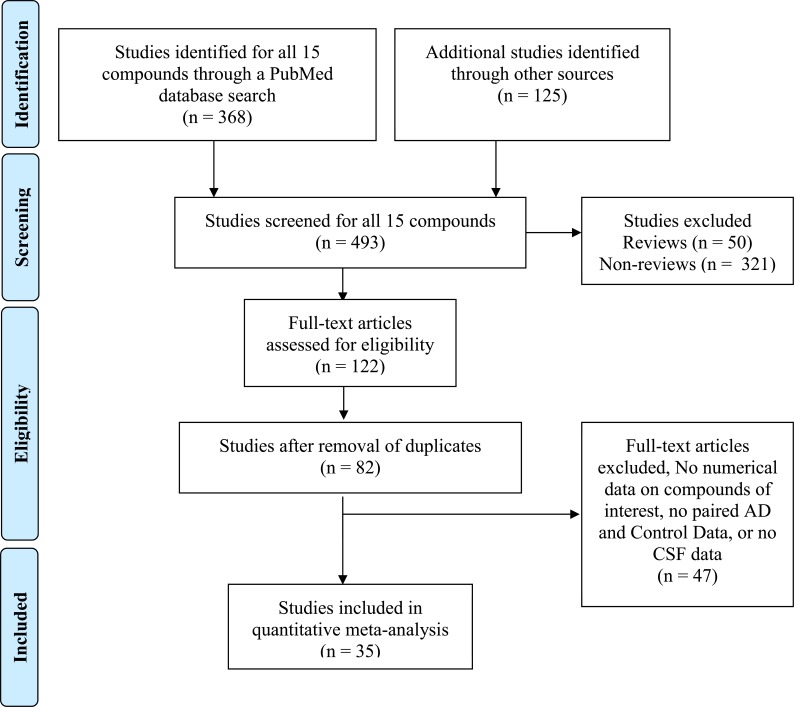
Fig. (1).
PRISMA Flow diagram showing meta-analysis selection of publications for all biomarkers, using PubMed database search as an example. Data represents pooled publications collected for 15 different markers for both space limitations and clarity. The duplicates were removed later in the work flow diagram, because this more accurately reflects the work flow which involved several authors independently searching for publications. Furthermore, several publications were common for several compounds, especially when amino acid analyses were performed. Additional publications from other sources highlight creativity of medical students in their searches. The workflow diagram is modified from Moher et al. [34]. Details of the individual markers investigated in this study are in Tables 1-4.

