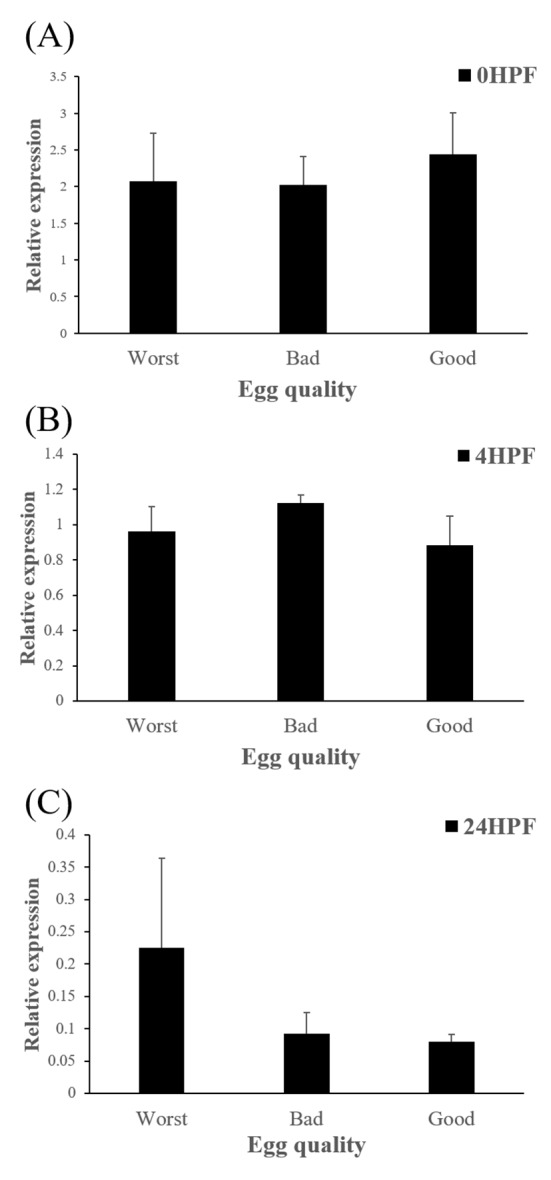
Fig. 5. Transcript level of cathepsin D (ctsd) in the eggs of three egg quality groups at different time.

0 HPF (hours post fertilization) (a), 4 HPF (b), 24 HPF (c). Each column represents mean±SEM (P<0.05).

0 HPF (hours post fertilization) (a), 4 HPF (b), 24 HPF (c). Each column represents mean±SEM (P<0.05).