FIGURE 5.
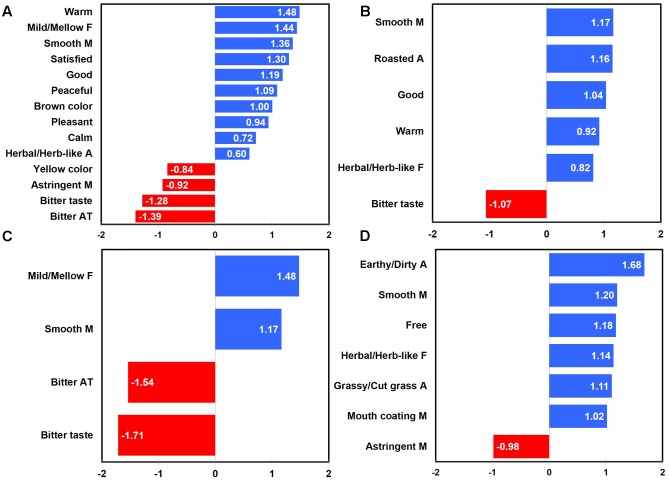
Mean drops in overall liking with respect to emotional responses and sensory attributes in green tea samples as a function of sample temperature: all temperatures (A), 65°C (B), 25°C (C), and 5°C (D). “A,” “F,” “M,” and “AT” next to sensory attribute term represent “aroma,” “flavor,” “mouthfeel,” and “aftertaste,” respectively. Numerical value of each emotion or sensory attribute term represents a mean difference in overall liking between the selected and unselected cases; a positive (or negative) value for each term indicates an increase (or decrease) of overall liking between the selected and unselected cases.

