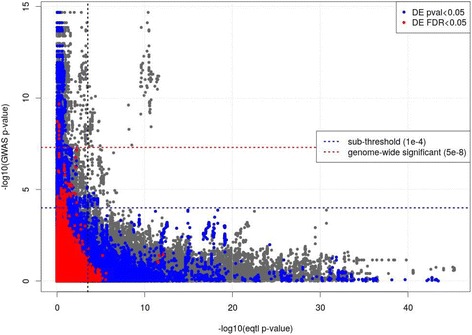
Fig. 2.

Plot of COPD GWAS p values vs. the cis-eQTL p values. Each point in the plot represents a cis-eQTL result with an rsID found in the prior GWAS. GWAS p values (y axis) are plotted against the expression QTL p values (x axis). A vertical dotted line indicates the threshold of significance (FDR < 5%) for the eQTL. Horizontal lines delineate genome-wide significant (red) and sub-threshold (blue) GWAS p values. The significant (red; FDR < 5%) and nominally significant (blue; p < 0.05) eGenes from gene expression profiling in COPD lung tissue are highlighted
