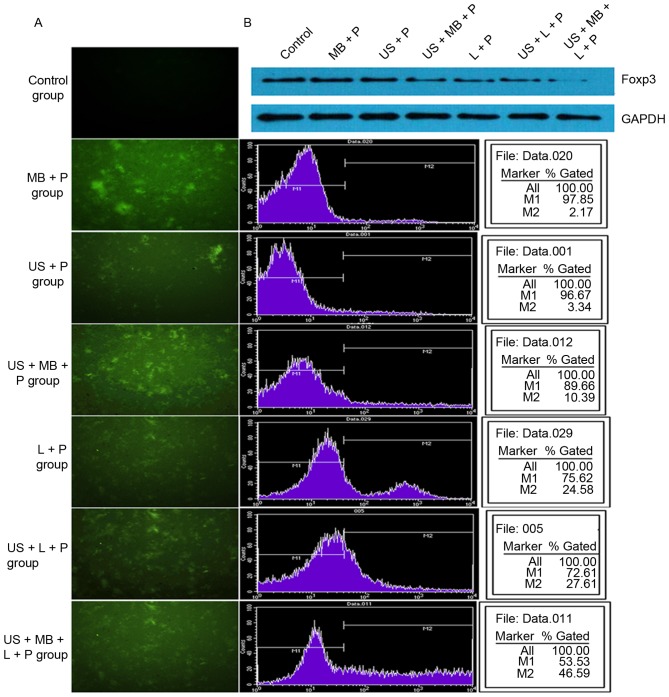
Figure 1.
Transfection efficiency in different treatment groups. (A) Fluorescence measurements and flow cytometry analysis indicated that the transfection efficiency was gradually increased in the control, MB + P, US + P, US + MB + P, L + P, US + L + P and US + MB + L + P groups and the (B) western blot analysis demonstrated a gradual decrease in Foxp3 expression. Foxp3, forkhead family transcription factor P3; MB, SonoVue microbubbles; P, Foxp3-microRNA plasmid; US, ultrasound; L, Lipofectamine® 2000.

