
Figure 5.
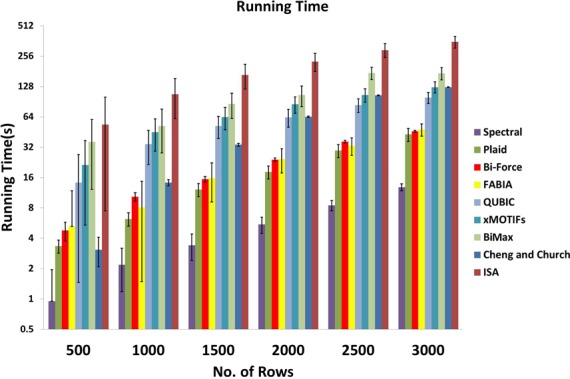
Error bars added. Running times of the nine algorithms for increasing number of rows in the expression matrix. The y-axis is in log-scale.
Official websites use .gov
A
.gov website belongs to an official
government organization in the United States.
Secure .gov websites use HTTPS
A lock (
) or https:// means you've safely
connected to the .gov website. Share sensitive
information only on official, secure websites.
Error bars added. Running times of the nine algorithms for increasing number of rows in the expression matrix. The y-axis is in log-scale.