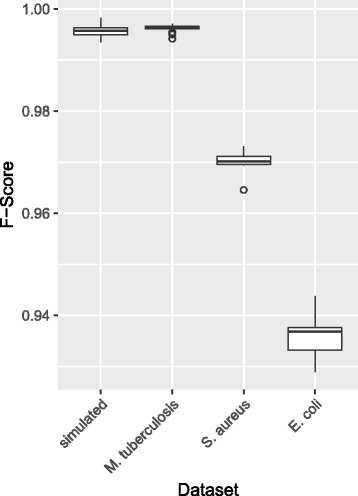
Fig. 3.

F-scores for comparing alignments using different sort orders for genomes. Genomes of each dataset were sorted by similarity and dissimilarity and randomly (100 times for the simulated and M. tuberculosis datasets and 10 times for the S. aureus and E. coli datasets) and aligned using the sequential workflow. The F-score is used as measure of consistency for alignment when comparing alignments with the dissimilar and random sort orders to the alignment with genomes sorted by similarity. All F-scores were similar within datasets and greater than 0.93 for all comparisons
