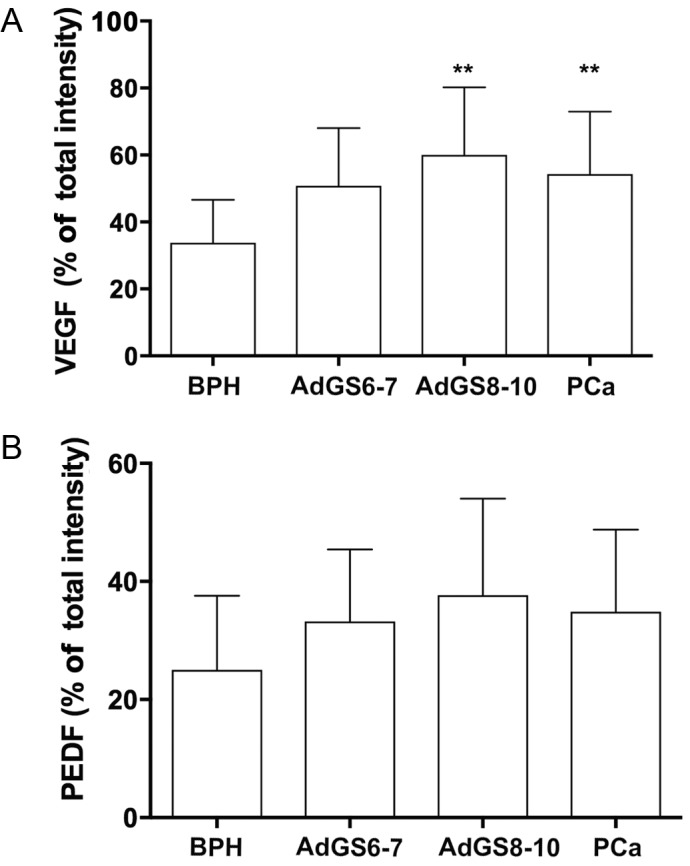
Figure 4.

Analysis of tissue immunostaining (magnification, ×40). Total intensity percentage of VEGF (A) and PEDF (B) for BPH (n=57); PCa (n=40); AdGS6-7 (n=25) and AdGS8-10 (n=15), bars indicate mean ± SD. **P≤0.01 vs. BPH, one-way ANOVA. BPH, benign prostatic hyperplasia; VEGF, vascular endothelial growth factor; PEDF, pigment epithelium-derived factor; ANOVA, one-way analysis of variance; AdGSC, adenocarcinoma with Gleason score.
