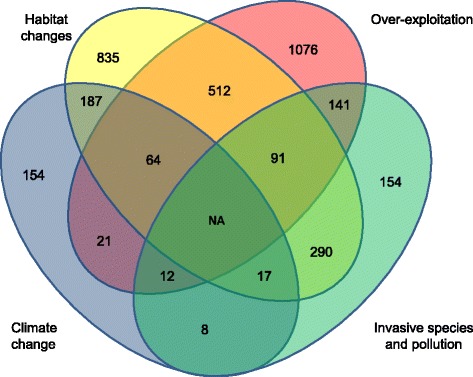
Fig. 2.

Number of populations affected by one or more human threats to biodiversity. Non-proportional Venn diagram illustrating the number of populations affected by one or more of the five main human threats to biodiversity. Note that data on invasive species and pollution have been combined to simplify the presentation, and that the Living Planet database registers a maximum of three threats per population. Data are from the Living Planet Report [1]. No data are available for the possible extent of the four influences combined (centre) as the database does not record more than three threats
