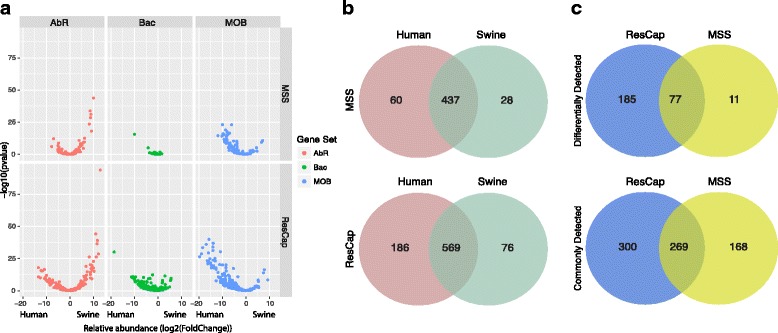
Fig. 7.

Differential study plots. Panel a shows the distribution of abundance variation between swine and human AbR resistomes (left), metal and biocide resistome (middle), and mobilome (right) in the form of volcano plots (fold change vs p value) using the different approaches MSS (top) and ResCap (bottom). Left and right branches in the volcano plot refers to higher abundance in humans and swine, respectively. Abscissa axis reflects the relative abundance between humans and swine samples. Positive values represent MGCs more abundant in swine than in human samples. Negative values represent MGCs more abundant in human than in swine samples and the values near to zero represent the MGCs with similar abundance between samples. Panel b summarizes the number of statistically significant MGCs of humans, swines, and the genes in common between them using both approaches: MSS (top) and ResCap (bottom). Panel c shows the Venn diagrams between approaches of differentially detected MGCs (top) and commonly (in both sets) detected MGCs (bottom)
