
Fig. 8.
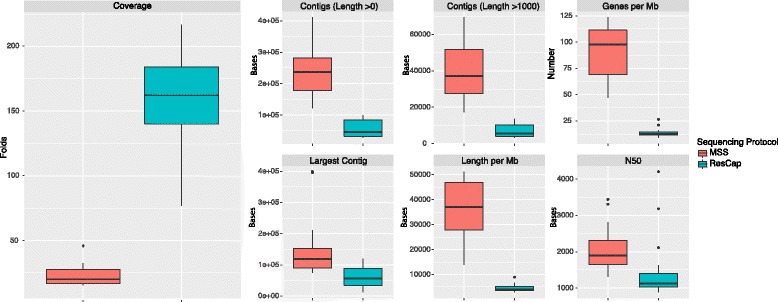
Assembly statistics. Assembly statistics was calculated by Quast software. Statistic summary of the main assembly variables; the number of contigs (all and longer than 1 kb), number of genes per sequenced Mb, the size of longest contig, the length of the assembled metagenome per sequenced Mb, and the N50 (the shortest contig length at 50% of the metagenome). Coverage data were calculated as the total sequenced bases divided by the total length (without normalizing). Length per Mb and genes per Mb were normalized by the total amount of megabases sequenced by each sample