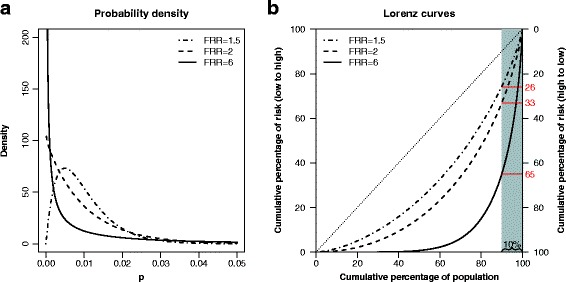
Fig. 5.

The distribution (a) of a beta distributed variable P, and its corresponding Lorenz curve (b), for three selected familial relative risks (FRRs). The expected value of P is set to 0.01. The 10% at highest risk (shaded area) account for 26%, 33%, and 65% of the diagnoses in the three scenarios, respectively
