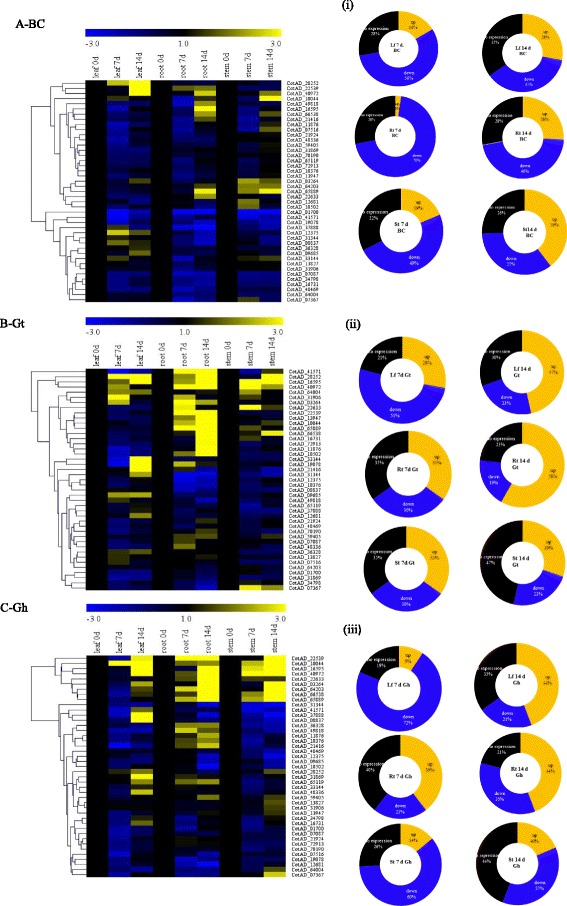
Fig. 8.

Differential expression of upland cotton LEA genes under drought stress. The heat map was visualized using Mev.exe program. (Showed by log2 values) in control, and in treated samples 7 and 14 days after drought treatment. a – BC2F1 (offspring), b – Gossypium tomentosum and c – Gossypium hirsutum. (i) Yellow – up regulated, blue – down regulated and black- no expression. (i). Percentage of genes exhibiting different responses to dehydration in leaf, root and stem of BC2F1; (ii). Percentage of genes exhibiting different responses to dehydration in leaf, root and stem of Gossypium tomentosum (iii). Percentage of genes exhibiting different responses to dehydration in leaf, root and stem of Gossypium hirsutum
