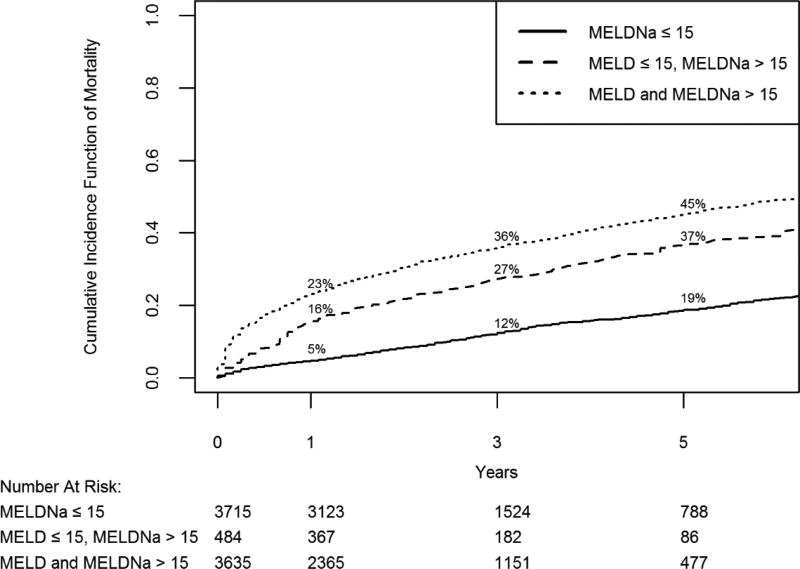
Figure 1. Predicted Mortality of Patients with Liver Cirrhosis.
Cumulative incidence function of mortality when treating liver transplantation as a competing risk for 3 groups of patients with liver cirrhosis. Predicted 1, 3 and 5 year mortality for each group is shown. If both the highest MELD and MELDNa score was ≤15, patients were stratified into a Low-MELDNa cohort; if the highest MELD was ≤15 but highest MELDNa >15, into a Mixed-MELD cohort and ; if both the highest MELD and highest MELDNa was > 15 into a High-MELD cohort
Gray’s test for equality of cumulative incidence function shows a statistical difference between the 3 groups (p<0.0001)
Abbrev: MELD/MELDNa: Model for end-stage liver disease sodium

